


New Delhi – India has been failing to recover its toxic air quality, while the smog-plagued cities keep increasing along with the diseases caused by the contaminated air.
Most of the 132 “non-attainment” cities in India, that is cities with poor levels of air quality have either “marginally improved” or increased their levels of air pollution since 2019, when the National Clean Air Programme (NCAP) was launched, a new analysis has found, The Print reported.

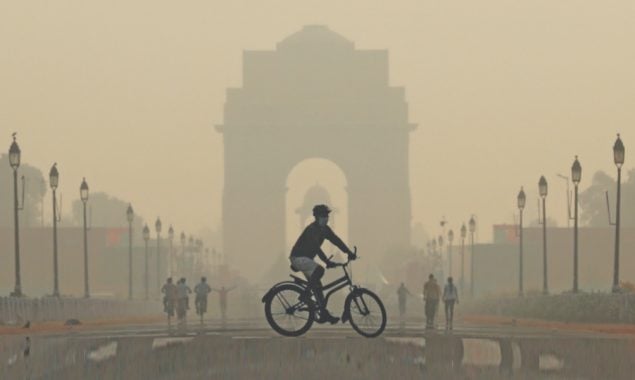
People commute past a mist machine spraying water along a street amid smoggy conditions in New Delhi in December 1, 2021. (Photo by Money SHARMA / AFP)
A non-attainment city is one whose air did not meet the national ambient air quality standards of 2011 to 2015. The National Clean Air Programme (NCAP) was launched for such cities, seeking to bring a 20-30 per cent reduction in pollution levels from PM2.5 and PM10 particles by 2024, using 2017 pollution levels as a base. The goal is non-binding.
Varanasi was able to achieve the largest reduction in air quality levels (52 per cent in PM2.5 levels and 54 per cent in PM10 levels). The only other cities to achieve an at least 20 per cent reduction were Hubli, West Bengal (42 per cent in PM2.5 levels and 40 per cent in PM10 levels), and Talcher, Odisha (20 and 53 per cent respectively), the report titled ‘Three years of the National Clean Air Programme: A status check‘by NCAP Tracker said.
NCAP Tracker was created by news portal CarbonCopy and Data Company Respirer Living Sciences, with the objective of tracking India’s progress in achieving the 2024 clean air targets set under the NCAP.

People commute past a mist machine spraying water along a street amid smoggy conditions in New Delhi in December 1, 2021. (Photo by Money SHARMA / AFP)
Ahmedabad recorded a reduction of 26 per cent in PM10 levels. However, Navi Mumbai’s PM2.5 levels increased to 53 micrograms per cubic metre from 39, and PM 10 levels increased to 122 from 96 compared to 2019, the report said.
None of the 132 cities, however, attained the national annual safe limits for particulate matter. Currently, the annual safe limit is 40 micrograms per cubic metre for PM2.5 and 60 micrograms per cubic meter for PM10.
Additionally, of the 132 cities, only 36 cities had data from 2019 and 2021 with an “uptime” of 50 per cent, meaning the systems were running 50 per cent of the time.
Worst performers
The analysis also looked at the 10 cities with the best and worst air quality in 2019, tracking their performance through to 2021 using data from the Continuous Ambient Air Quality Monitoring System (CAAQMS).
When it comes to PM2.5 levels collected from CAAQMS data, Ghaziabad fares the worst, and has shown negligible improvement since 2019 (117 μg/m3 in 2019 and 111 μg/m3 in 2021). It also fares the worst in the PM10 category, having recorded 243 μg/m3 in 2019 and 238 μg/m3 in 2021.
Varanasi was also among the most polluted in 2019, with a PM2.5 level of 99ug/m3, which reduced to 44ug/m3 in 2021. Other cities in the list include Moradabad (100 μg/m3 to 95 μg/m3), Noida (114 to 98), Howrah (69 to 59), Mandi Gobindgarh (61 both times), Asansol (60 to 57), and Kolkata (56 both times).
Many of these cities (Ghaziabad, Delhi, Noida, Varanasi, Moradabad, Jodhpur, Mandi Gobingarh and Howrah) also had the highest PM10 levels.

Pigeons sit on a light post amid smoggy conditions in New Delhi on December 1, 2021. (Photo by Money SHARMA / AFP)
“Despite the constant focus on the air pollution woes of the capital city, Delhi reduced its PM levels only marginally. Based on the CAAQMS data, its PM2.5 levels dropped from 108 μg/m3 in 2019 to 102 μg/m3 in 2021 and its PM10 levels reduced from 217 μg/m3 to 207 μg/m3 during the same period,” the analysis showed.
“The top 10 most polluted cities from 2019 continue to occupy the most polluted cities list in 2021 too. This goes to show how hard the problem of reducing air pollution is that we are faced with. Ghaziabad has remained the #1 most polluted city, with Delhi #2 and Noida #3. The sources in these cities are affecting the entire airshed and solutions need to be thought about across political and governance boundaries,” Ronak Sutaria, CEO and Founder, Respirer Living Sciences, said in a statement to The Print.
Least polluted in 2019
“Vijaywada in Andhra Pradesh was the least polluted among the non-attainment cities with a PM 2.5 annual average of 24 ug/m3. However, in 2020, monitors reported only 3 per cent uptime and no data was not available for the city in 2021 and hence tracking its progress was not possible,” said the analysis.
In 2019, the cities of Mumbai, Navi Mumbai, Nashik and Chandrapur were among the least polluted cities, but they recorded an increase in PM2.5 levels in 2021.

People commute along a street amid smoggy conditions in New Delhi on December 1, 2021. (Photo by Money SHARMA / AFP)
“For instance, Mumbai PM2.5 levels were up from 34 μg/m3 in 2019 to 53 μg/m3 in 2021, an increase of 38 per cent. On the ranking table, Mumbai slipped from seven in 2019 to 15 in 2020 and 27 in 2021. Despite the Covid-19 resultant lockdown, the city’s annual PM2.5 levels were higher in 2020 as compared to 2019,” the analysis of the city showed.
Similarly, for PM10, “While Chennai, Tamil Nadu was the least polluted in terms in 2019, an increase of levels from 55 μg/m3 to 58 μg/m3, it did not hold on to its spot in 2021. The other city which saw a drastic dip in ranking (from 7 to 26) was Mumbai where PM10 increased from 82 μg/m3 in 2019 to 104 μg/m3,” it said.
Usage of funds
The analysis also looked at the usage of state and union territory-wise funds towards the NCAP, and found that Chandigarh utilised the most (81 per cent), and Jammu and Kashmir used the least (1.48 per cent). Maharashtra utilised just 7.92 per cent.
“According to the CAAQMS data on the NCAP Tracker, while Mumbai increased its CAAQMS monitors from 9 to 21 in the three years, Pune installed 8 monitors in 2021 as opposed to just one in the previous two years, and Navi Mumbai got four monitors, all other cities did not report an increase in monitoring capacity. Most of the cities analysed for the exercise also reported an increase in PM levels,” it stated.
The analysis also ranked cities according to data collected from the National Air Quality Monitoring Program (NAMP). However, this data is not up to date.
Courtesy: The Print
Read More News On
Catch all the International News, Breaking News Event and Latest News Updates on The BOL News
Download The BOL News App to get the Daily News Update & Follow us on Google News.